
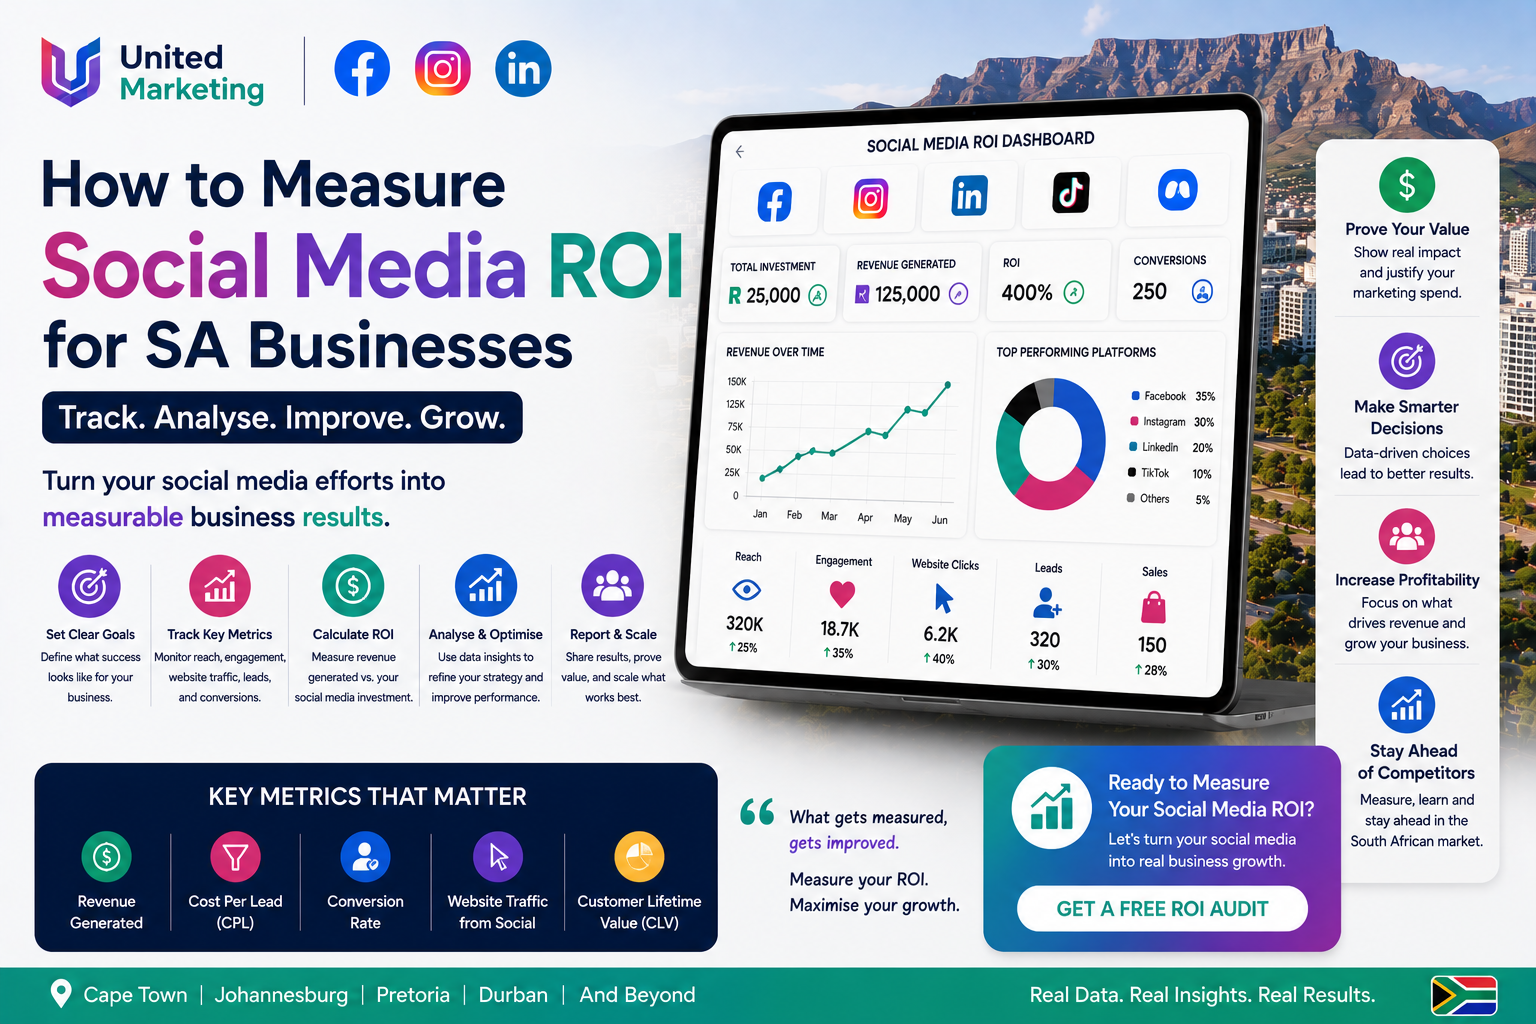
Most South African businesses measuring social media success by follower count and likes are measuring the wrong things entirely. These vanity metrics feel good but have zero correlation with revenue. This guide shows you how to measure social media ROI the right way — the metrics that actually connect to leads, clients, and rand value generated for your Cape Town or Johannesburg business.
The Problem With Vanity Metrics
Follower count, likes, and reach tell you how many people saw your content — not whether any of them became customers. A Cape Town restaurant with 15,000 Instagram followers generating 3 table bookings per month from social media has far worse social media ROI than one with 2,000 followers generating 50 weekly reservations through strategic social media marketing. What matters is the business outcome, not the audience size.
The Two-Layer ROI Framework for SA Businesses
Framework: Layer 1: Leading Indicators (predict future business outcomes) | Layer 2: Lagging Indicators (measure actual business outcomes). Both are required for complete social media ROI measurement.
Layer 1: Leading Indicators — Engagement Quality Metrics
| Metric | What It Measures | SA Benchmark |
| Engagement Rate | % of audience interacting with content | 2–5% is healthy for most SA accounts |
| Reach Growth | Month-on-month increase in unique accounts reached | 10–20% monthly growth is strong |
| Story View Rate | % of followers viewing your Stories | 20–40% is typical for active SA accounts |
| Saves & Shares | Content saved or shared — signals genuine value | Higher than likes = strong signal |
| Link Clicks | Clicks from social to your SA website | Track in Google Analytics 4 by source |
| Profile Visits | Users visiting your profile after seeing content | Indicates discovery and interest |
Layer 2: Lagging Indicators — Business Outcome Metrics
| Metric | How to Track | Why It Matters |
| Leads Generated | Form submissions, WhatsApp clicks, calls from social | Direct business impact — most important metric |
| Cost Per Lead | Total social spend ÷ total leads from social | Compares social ROI to other SA channels |
| Website Sessions from Social | Google Analytics 4 → Acquisition → Social | Shows social traffic quality and quantity |
| Conversion Rate from Social | Social sessions ÷ conversions from social | Quality of social traffic vs other sources |
| Revenue from Social (ecommerce) | GA4 ecommerce report by source/medium | Direct rand value attribution |
| Customer Acquisition Cost | Total social spend ÷ new clients from social | Lifetime value context for SA businesses |
Tools for Measuring Social Media ROI in South Africa
Free Tools
- Google Analytics 4 — essential for tracking website traffic and conversions from social media
- Meta Business Suite Insights — Facebook and Instagram performance data
- LinkedIn Analytics — company page and content performance for SA B2B businesses
- Google Search Console — tracks organic search impact of social-driven brand awareness
Paid Tools
- Hootsuite Analytics — multi-platform reporting across all SA social channels
- Sprout Social — advanced analytics and competitor benchmarking for SA businesses
- Later Analytics — Instagram-focused with optimal posting time analysis for SA audiences
Setting Up Proper Tracking for SA Social Media
1. Install Google Analytics 4 on your Cape Town or Johannesburg business website
2. Set up UTM parameters on all social bio links and paid ad destination URLs
3. Create Conversion Goals in GA4 for form submissions, WhatsApp clicks, and calls
4. Install the Meta Pixel for Facebook and Instagram conversion tracking
5. Enable call tracking software to attribute phone calls to social media sources
Calculating Social Media ROI in ZAR
ROI Formula: Social Media ROI = ((Revenue from Social − Cost of Social) ÷ Cost of Social) × 100. Example: Revenue R30,000 − Costs R8,000 = R22,000 ÷ R8,000 × 100 = 275% ROI
Monthly Social Media Reporting Template for SA Businesses
| Report Section | Key Metrics to Include |
| Audience Growth | Total followers, net new followers, follower growth rate vs last month |
| Content Performance | Top 3 performing posts, avg engagement rate, reach vs previous month |
| Website Traffic | Sessions from social, social traffic % of total, bounce rate from social |
| Lead Generation | Total leads from social, cost per lead, leads by platform (Facebook vs Instagram) |
| Paid Ads Performance | Ad spend in ZAR, cost per lead, ROAS, top performing ad creative |
| Month-on-Month Summary | What improved, what declined, recommended actions for next month |
Frequently Asked Questions
How do I attribute leads to social media when customers use multiple channels?
Multi-touch attribution is the honest answer — most SA customers interact with a business across multiple channels before converting. Google Analytics 4’s attribution reports show which channels assisted conversions even if they weren’t the final touchpoint. For practical reporting, track “last-click” attribution as a minimum while acknowledging that social media often plays an assist role in the customer journey even when it’s not the final conversion source.
What is a realistic social media ROI for a Cape Town service business?
ROI varies enormously by industry, strategy quality, and what’s included in “costs”. Organic social media managed in-house with minimal spend can deliver very high ROI on paper. Paid social campaigns for Cape Town service businesses typically generate 150–400% ROI when cost per lead is compared against customer lifetime value. We recommend tracking ROI by individual campaign rather than across all social media activity combined, as this reveals where your SA investment is actually working.
Should I measure ROI separately for organic social and paid social?
Yes, always. Organic social media ROI reflects your content strategy’s effectiveness — how well your brand content generates traffic and leads without direct ad spend. Paid social ROI reflects your advertising efficiency — cost per lead from Facebook and Instagram Ads. Combining them gives you a blended average that makes it impossible to determine which is actually performing and where to invest more.
How long should I measure social media ROI before making strategy decisions?
We recommend a minimum 90-day window before drawing significant conclusions from social media data. Social media results are affected by content learning curves, seasonal SA patterns, and audience relationship building that takes time. Month-one results are rarely representative of mature campaign performance. After 90 days, you have enough data to identify genuine trends and make informed strategic decisions about your Cape Town or Johannesburg social media investment.
What should I do if my social media ROI is negative?
A negative social media ROI means your social costs exceed measurable returns — which is common in early months or with poorly structured strategies. First, review your conversion tracking to confirm you’re measuring all lead sources correctly. Then audit your content strategy for commercial intent — are you posting content that drives enquiries, or purely entertaining content? Review your audience targeting for paid campaigns. Ensure your social profiles have clear CTAs and contact options. Negative ROI in month one is often a tracking issue; persistent negative ROI after 90 days signals a strategy issue.
Want monthly social media reports that show actual leads and ROI — not just likes? Get a free social media audit and reporting setup today. Get My Free Social Media ROI Audit →
